Learn from the past to build for the future.
At St. Mary’s College of Maryland, the African and African Diaspora Studies Program (AADS) invites students to explore the rich histories, cultures, and experiences of African peoples on the continent and across the world. Through an interdisciplinary approach, the program equips students with the tools to critically analyze the legacies of colonialism, migration, resistance, and creativity. Courses draw from history, literature, sociology, art, and more, fostering global understanding and social responsibility in an increasingly interconnected world.
")
of students did experiential or community based learning
Study Abroad programs for students
SMCM's student-to-faculty ratio supports students through their time on campus and beyond
The Cross-Disciplinary Experience
Cross-disciplinary studies can increase intellectual community across disciplines, encourage cohesion in the choice of electives, and promote combinations of methods and materials that challenge the boundaries of knowledge.
They involve at least three academic disciplines and require 18 to 24 credit-hours, at least eight (8) of which must be at the upper-division level.
Cross-disciplinary studies include an integrative component such as a common course or requirement. At the discretion of the specific cross-disciplinary studies committee, students may complete the St. Mary’s Project in the study area, provided they secure the approval of the department in which they are majoring. Completion of the course work in a cross-disciplinary study area is noted as a specific minor on a student’s transcript.
AADS Minor
African and African Diaspora Studies is a cross-disciplinary minor designed to enable students explore, examine and critically analyze the African presence in a global context. This presence stretches back to antiquity in Europe and Asia, and for centuries in the Americas. Students are provided with the background and tools to investigate the agency, experiences, and movement of African and African Diaspora people that span time and place and bridge academic disciplines. The minor offers courses in several departments from faculty representing a number of academic disciplines.

Honors College Promise
")
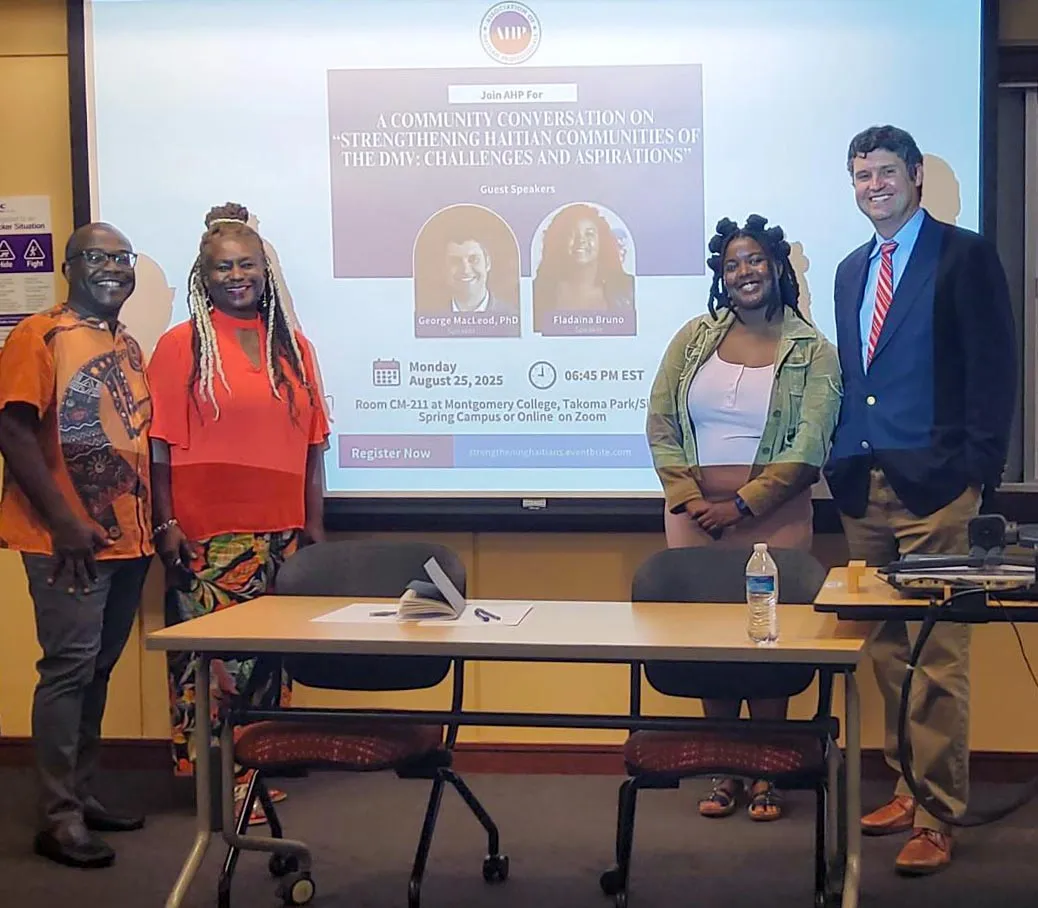
Students in this program benefit from a range of real-world learning opportunities—from study abroad experiences in Morocco and South Africa to internships with social justice and cultural heritage organizations. Undergraduate research is a core part of the program, with students examining everything from diaspora literature to community activism. With mentorship from interdisciplinary faculty, students graduate with meaningful academic and professional experiences that prepare them for leadership in diverse fields.
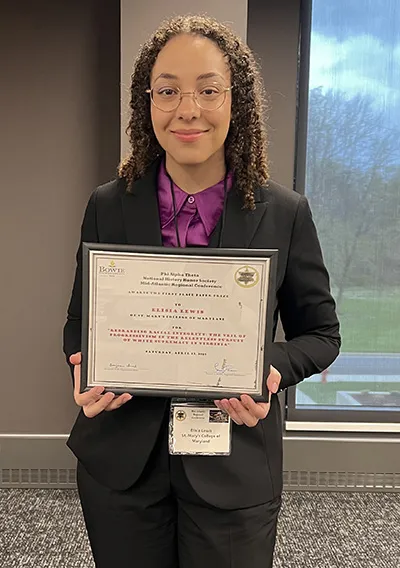
"These past two weeks were the busiest, yet most rewarding, point in my college career...I received the African and African Diaspora Studies Award and David Beers Quinn Award in History from St. Mary's College of Maryland, and I am extremely grateful that my work and dedication to both fields are recognized by the amazing faculty!"
- Elisia Lewis '25
After you Graduate
Graduates of the Africa and African Diaspora Studies Program pursue careers in education, public service, law, international development, and the arts. Many continue their studies in graduate programs focused on African Studies, race and ethnicity, or public policy. With strong communication skills, cultural fluency, and critical analysis, our alumni make meaningful contributions in diverse communities and institutions.
")
LATEST NEWS

Connect with Your Program Chair
All the faculty here at St. Mary's College of Maryland want to help you explore your interests and set you up for success. We look forward to connecting with you and meeting you on campus.

Department Chair
Associate Professor of History | African and African Diaspora Studies Chair & Contact
gmdennie@smcm.eduHonors Society
